Candid put numbers this week to a question development staff keep asking: does donor-advised fund money behave differently than foundation money? A new side-by-side of five years of giving data says mostly no. The exceptions deserve your attention.
On September 16, Candid released an interactive dashboard comparing donations from 57 national DAF sponsors, which host 492,257 DAF accounts, with grantmaking by 100,499 private foundations from 2020 through 2024. One caveat before the findings: the analysis covers only sponsors the DAF Research Collaborative designates as national, meaning the large commercial and independent sponsors (donation processors are excluded). Community foundations and other sponsor types are not in this data set.
DAFs Now Move More Than 15 Cents of Every Giving Dollar
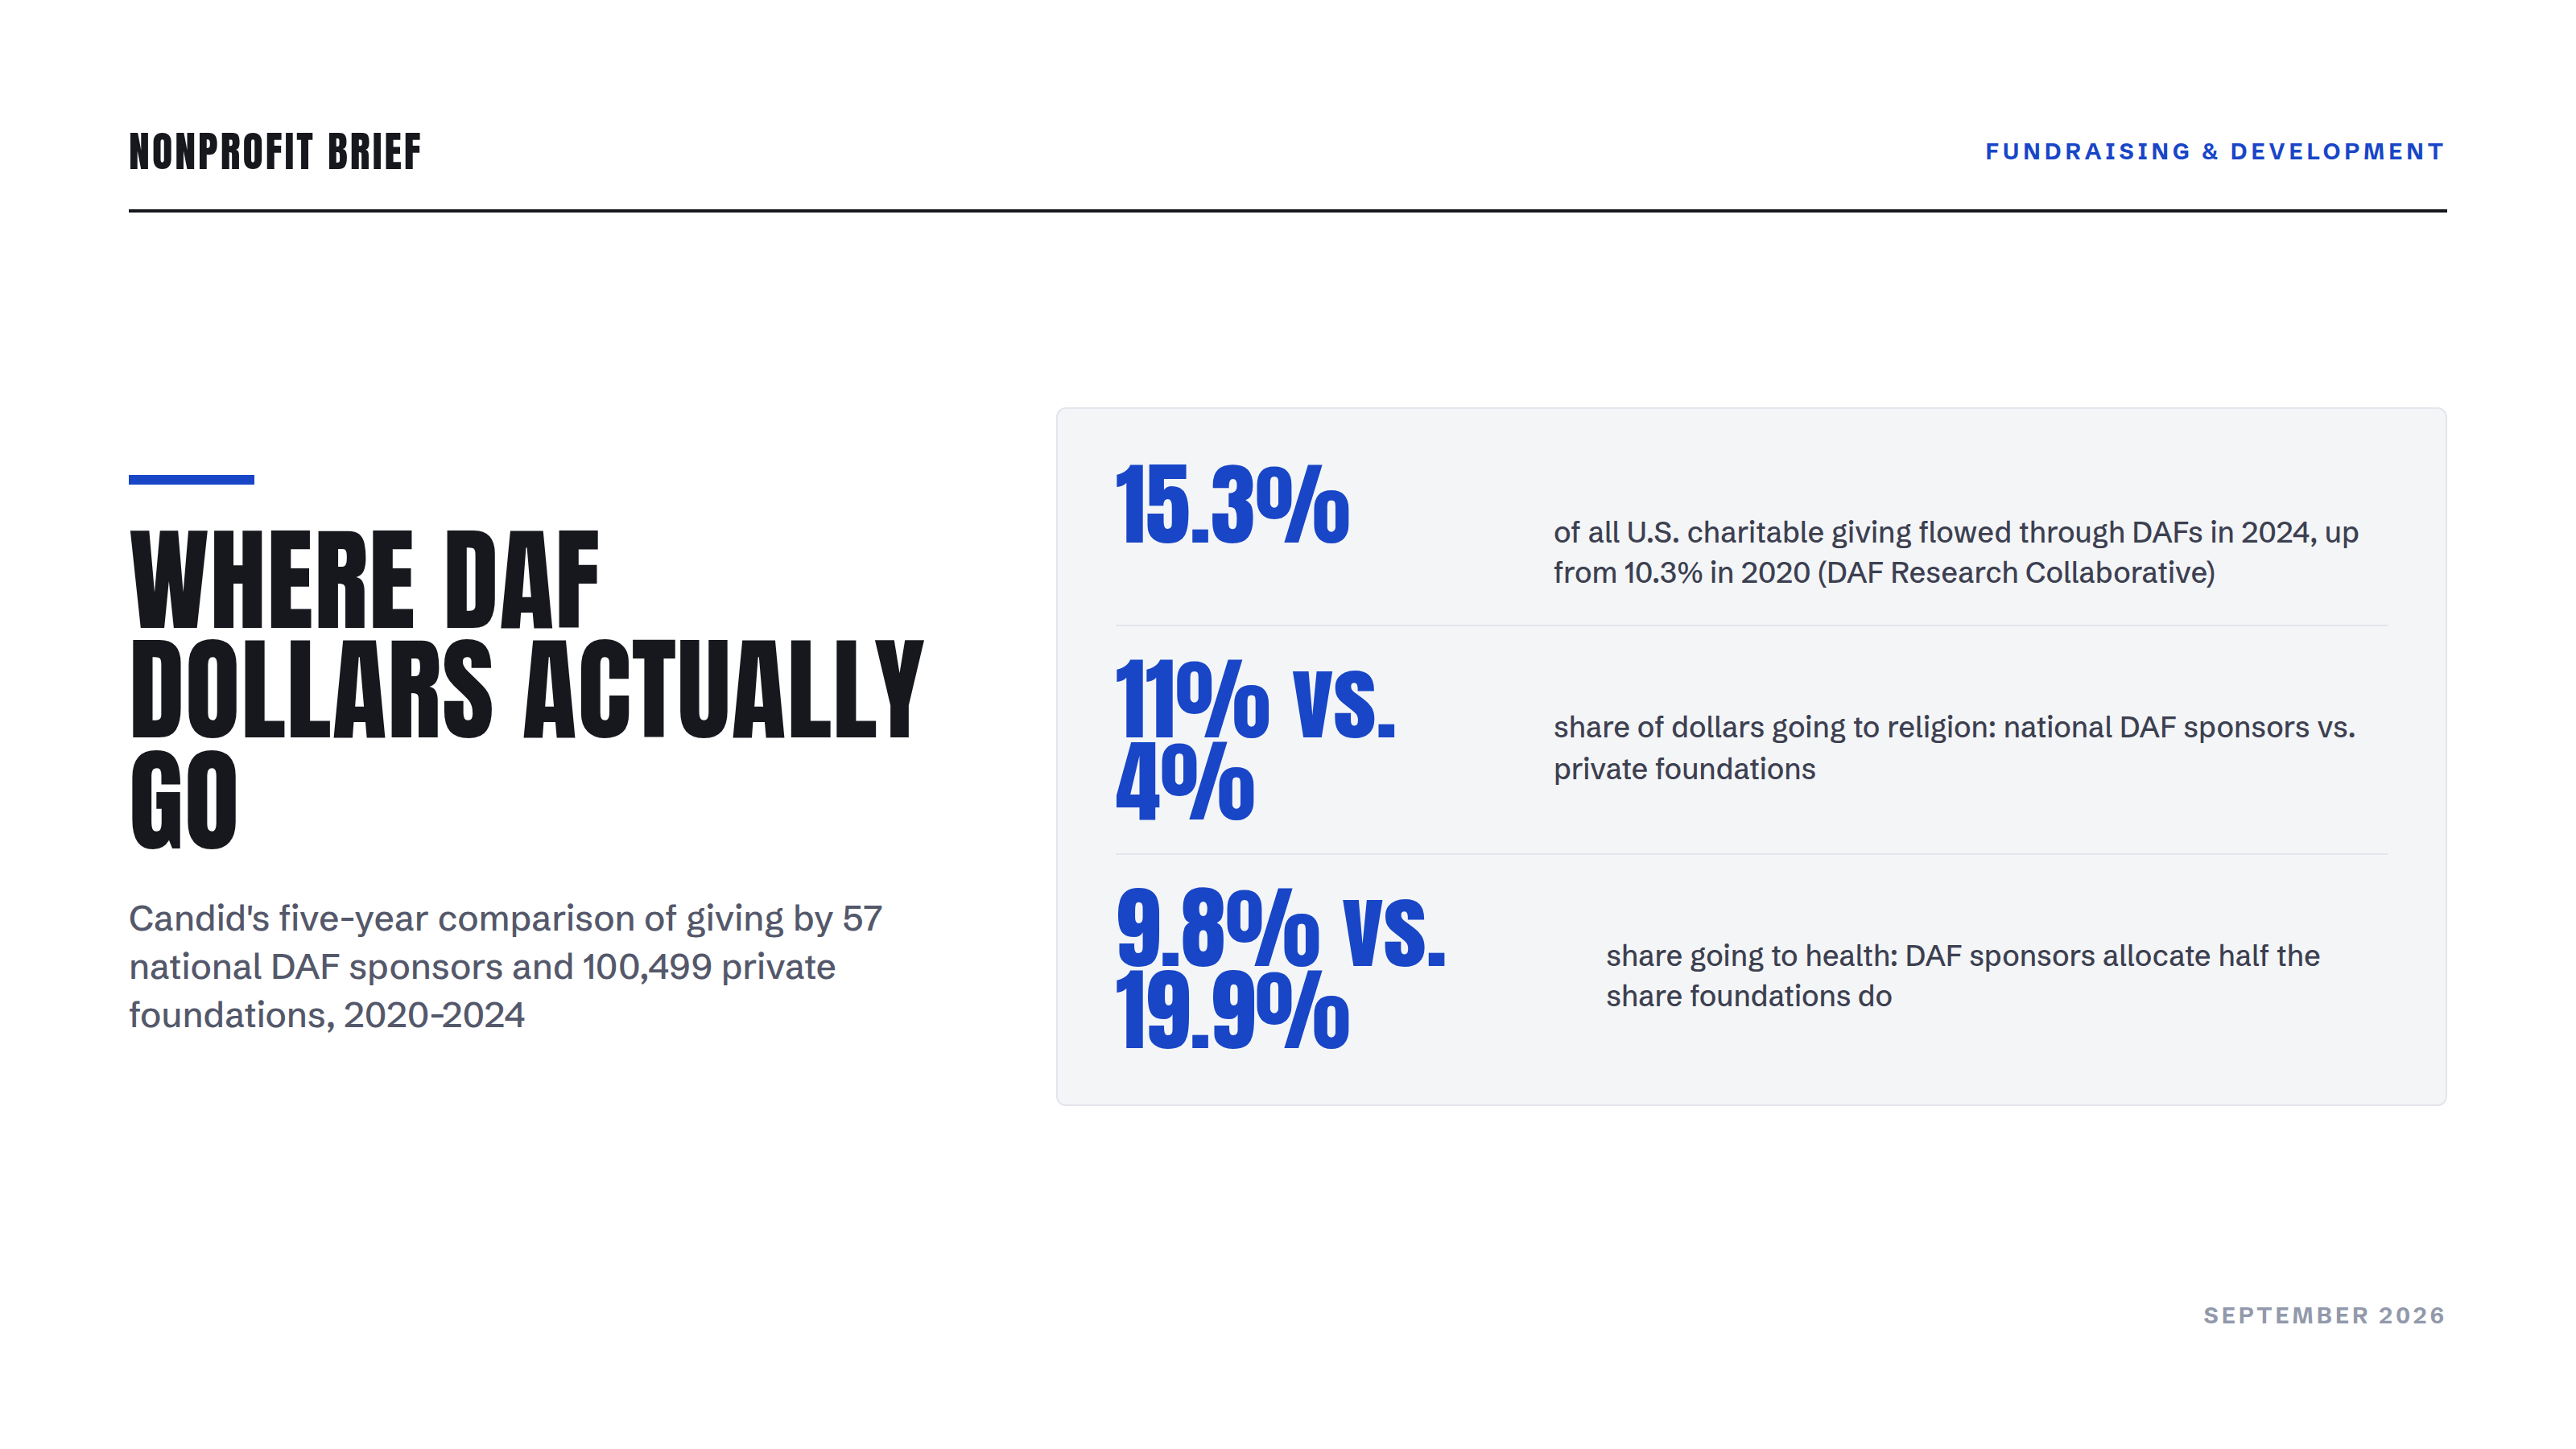
First, the scale. According to the DAF Research Collaborative, cited in Candid's analysis, giving from DAFs grew from 10.3% of all U.S. charitable giving in 2020 to 15.3% by 2024. The DAF Research Collaborative's latest annual report counts $64.9 billion in DAF grants to charities in 2024, a bit more than half of the $118.5 billion private foundations moved the same year, and puts the aggregate DAF payout rate at 25.3% against roughly 8% for private foundations. Whatever you think of the vehicle, it is no longer a niche one.
The Priorities Mostly Overlap
Rank the cause areas and the two lists look like siblings. Education draws the largest share of dollars from both sources: 25% of DAF donations and 23% of foundation grant dollars. Human services sits near the top of both lists, at 14% and 13% respectively. As Candid's director of analytics Anna Koob writes, "the overall pattern of what gets funded looks familiar." In aggregate, DAF donors did not invent a new philanthropy. They fund the same map with slightly different weights.
Religion and Health Are the Two Real Divides
Two cause areas break the pattern. Religion draws 11% of dollars from national DAF sponsors, more than twice the 4% share foundations allocate. Health runs the other way: it takes 19.9% of foundation grant dollars, nearly a fifth, but only 9.8% of DAF donations.
The dashboard does not explain why, but the shape fits long-running individual giving patterns: DAF accounts are household giving vehicles, and religious organizations have always drawn most of their support from households, while institutional health philanthropy is concentrated in large legacy foundations. If you fundraise for a faith-based organization, DAF dollars are disproportionately your dollars. If you work in health, the foundation pipeline still carries the most weight.
Midsize Nonprofits Get a Thinner Slice of DAF Dollars
Candid also cut the data by recipient size. Organizations with $1 million to $10 million in annual expenses capture 26% of foundation grant dollars but only 19% of DAF donations. That gap is worth knowing if you sit in that band. Foundation grants respond to proposals; DAF grants respond to relationships with individual donors, and midsize organizations often have grant writers before they have major-gift capacity. A growing DAF market will not route itself to you.
How to Put the Data to Work
The practical read is that DAF donors are not a separate species. They are your individual donors giving through an intermediary, and the sponsor is plumbing, not the decision maker. The behavioral case for courting them is strong: the 2026 DAF Fundraising Report from K2D Strategies and Chariot, a study of 54 national nonprofits that together received $3.3 billion in DAF revenue, found the median DAF gift runs 12 times the median non-DAF gift, and DAF donor retention reached 59% in 2025, 13 percentage points above non-DAF donors.
Three moves follow directly. Make sure your gift processing can identify DAF grants and tie each one back to the advising donor, because the check arrives from the sponsor and the thank-you belongs to the household behind it. Put DAF giving instructions in your year-end appeal materials, since the fourth quarter is when donors move money out of their accounts. And if the religion and health numbers above changed your expectations, bring the revenue-mix conversation to your board now, not in December.
The takeaway
Candid's new dashboard confirms that DAF money mostly follows the familiar philanthropic map, with two exceptions: religion gets more than twice the share from national DAF sponsors that it gets from foundations, and health gets about half. DAFs moved 15.3% of U.S. giving in 2024 and the share is climbing. Treat DAF donors as what they are, individual donors with larger gifts and better retention, and build the identification and stewardship plumbing before year-end giving season arrives.