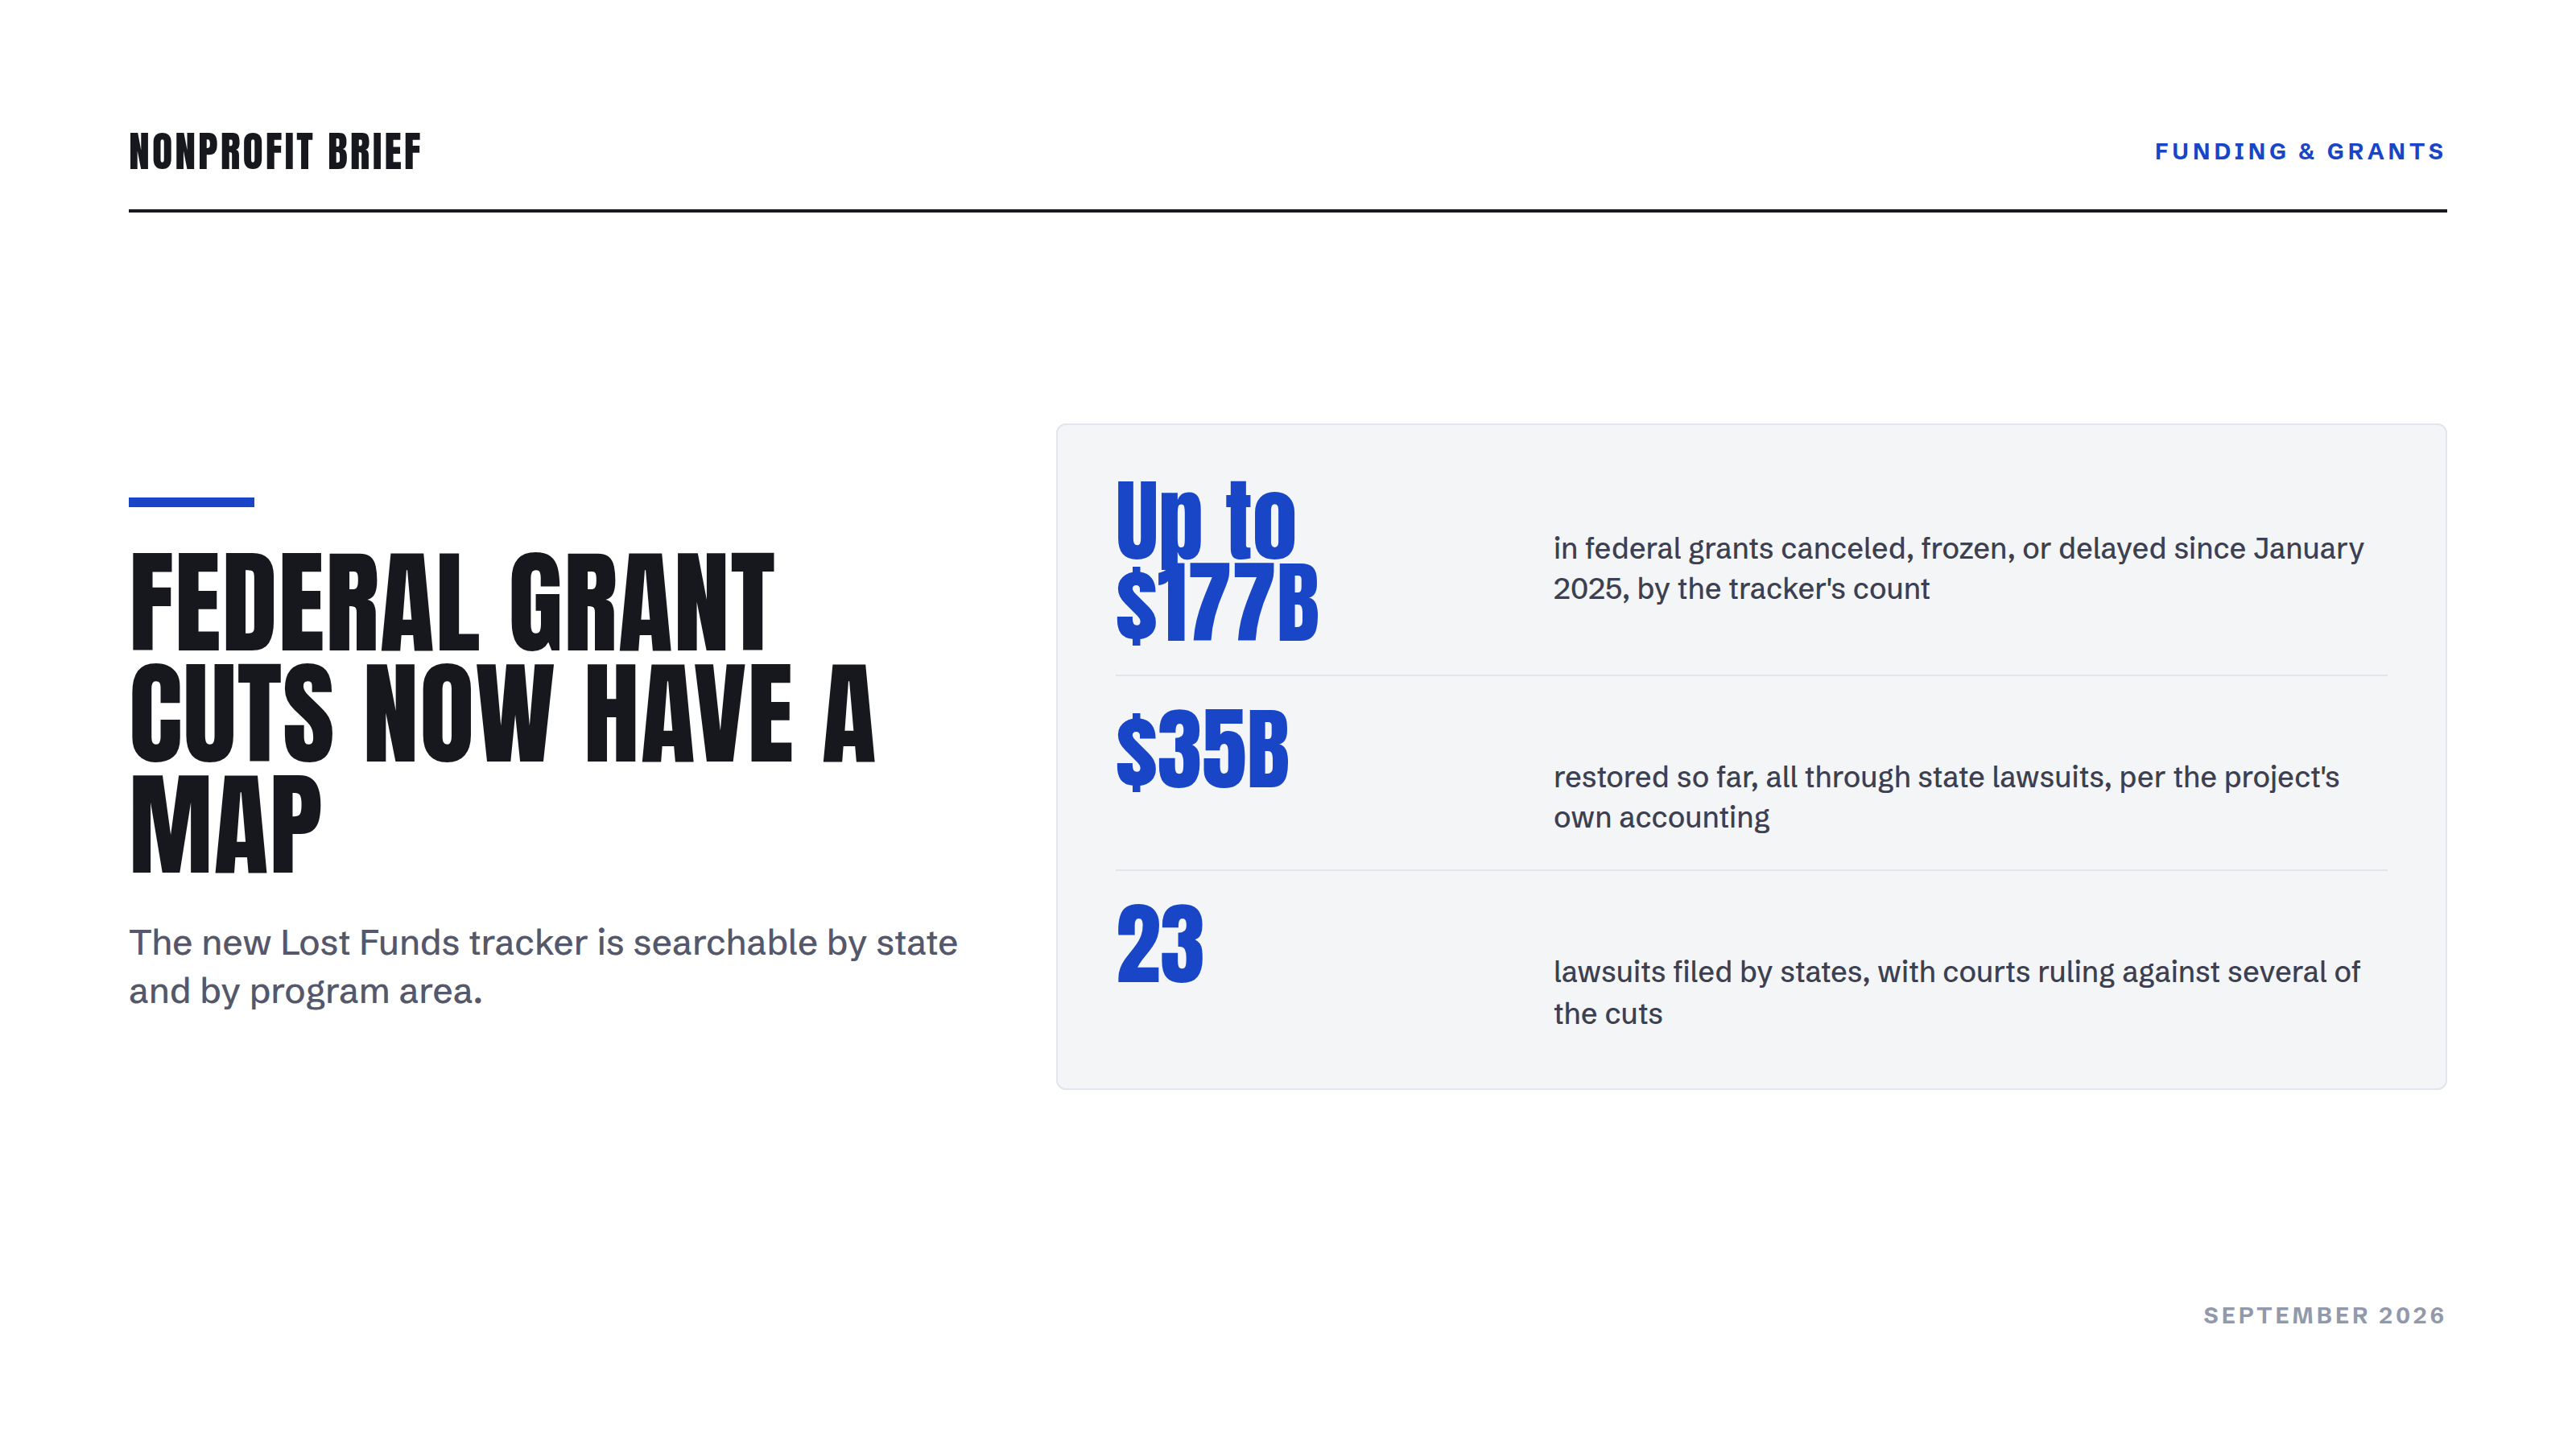
A new public database puts a single number on what has happened to federal grant funding since January 2025: up to $177 billion canceled, frozen, or delayed. The tracker, called Lost Funds, launched September 16 from the States United Democracy Center and Grant Witness, and it is searchable by state and by program area. If your organization holds federal money, or lost it this year, the disruption now has a map.
What the Tracker Counts
Lost Funds catalogs three kinds of disruption: formal grant cancellations, funding freezes, and slowdowns in grant-making pace. The launch announcement says the database covers all 50 states and Washington, D.C., spanning 17 policy sectors and 16 federal agencies over the past 20 months, with health grants taking the largest hit at $58.1 billion by States United's count. AP's coverage notes that nutrition, environment, and disaster relief round out the largest categories, and relays the sponsors' estimate that the total equals nearly 10 percent of federal discretionary spending.
The "up to" in that figure, which AP carries and the tracker's own front page does not, is doing real work. The tracker counts money that was disrupted at any point, not money that is permanently gone, and its cancellation category sweeps in some procurement contracts alongside grants. Some frozen funds have since moved. By the project's own accounting, litigation has restored about $35 billion, with 23 lawsuits filed by states so far. Courts have ruled against the administration in several grant cases, a pattern we covered in the Solar for All terminations and the vacated HUD homelessness NOFO.
Who Shows Up in the Data
The recipients are not abstractions. The tracker counts 3,494 local governments, 753 school districts, 437 businesses, and more than 15,000 other recipients touched by a disruption, a category that includes the nonprofits delivering much of this work as grantees and subgrantees. By total dollars disrupted, California, Texas, New York, Illinois, and North Carolina lead the list, though the per-capita view on the site tells a different story for smaller states. AP's reporting pulls out the texture behind the totals: maternal health grants in Michigan, education research in Mississippi, assistance to minority farmers in Iowa.
For nonprofits specifically, the subgrantee position is the blind spot. When a state agency's federal award is frozen, the community organizations funded under it often learn about the problem weeks later, through a delayed reimbursement rather than a notice. A database organized by state and program area is genuinely useful for seeing that risk coming.
Where the Numbers Come From
The project pulls grant data from USAspending.gov, the government's own spending database, and tracks litigation through court records. The team identifies disruptions through agency communications, court filings, media reports, and direct submissions, then verifies them against the spending data. The site says it will update regularly as new actions and rulings land.
Two caveats worth carrying. First, the sponsoring organizations are litigation-adjacent: States United is a democracy-focused legal group, and Grant Witness documents grant terminations, partly for use in court. The underlying data is public and checkable, but the framing is theirs. Second, a tracker built on public records will lag reality in both directions. Some listed freezes have thawed, and some recent disruptions will not appear yet.
What to Do With It
Three practical uses. If you hold federal grants, search your state and program area to see whether your funding stream shows disruptions you have not been formally notified about; a slowdown upstream often reaches subrecipients late. If you lost funding this year, the tracker's litigation data shows whether your program area is already in court, which matters because every dollar the project counts as restored came back through those lawsuits. Money has also returned outside the courts, as when the administration released billions in frozen education grants in July 2025 under congressional pressure, but the tracker does not tally that path. And if you are budgeting for 2027, the sector-level numbers are a better base for planning than any single agency's press releases. Our earlier look at federal grant declines found new grant-making down sharply in the first half of 2026; this tracker now covers the cuts to money already awarded.
The full dataset is downloadable, which makes it usable for board memos without screenshotting a map.
The Takeaway
Lost Funds is billed by its sponsors as the first tool to total federal grant disruptions since January 2025 in one verifiable place, and it is certainly the most comprehensive one public so far: up to $177 billion across every state, with about $35 billion restored through litigation. Treat the headline number as a ceiling, not a balance. The useful part for a nonprofit is not the total, it is the search box: look up your state and your program area, and take what you find to your next budget conversation.